What SaaS Analytics can learn from Poultry Farmers

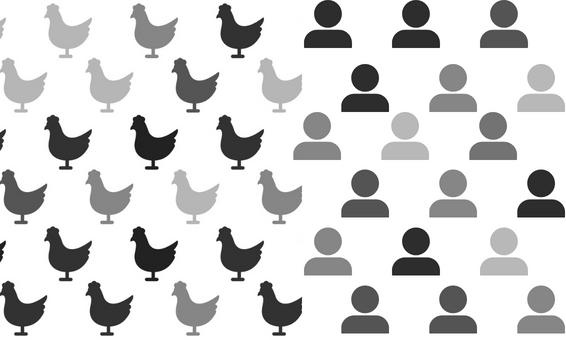
Turns out the world of laying hen performance and SaaS membership analysis share more than a few quirks. From clucky hens to click-happy users, join me as I share some unexpected crossovers between these two worlds, where feathers meet features, and egg production has a lot more in common with membership models than you might think.
Time to read: 5 minutes.
Intro
Experience across various industries and products can lead you to recognise similar business problems that exist in different forms. Today, I'm reflecting on learnings working in two different industries; from my time at Better Origin, an innovative sustainable feed (via insect bioconversion) startup, to Loqbox, an awesome fintech company focused on building users' credit scores and credit history. While moving between products and projects, I can't escape the feeling of deja vu when I look at a graph and spot a familiar trend.
At first glance, it doesn't make sense to compare chickens and software users. Once I pick apart the similarities and differences between the two, I realise it doesn't matter what the shape of the product is - if there is a pattern then as analysts it's our job to unravel them - even if it means comparing farms to digital products to do so.
My main takeaways have been:
- Identify parallels in how different businesses track progress. Create a web of frameworks you can draw on when you recognise similar business problems that are outwardly different.
- Understand that principles and patterns don't change, but the unique combinations of these patterns will result in different end products. By doing so, you can enable a more nuanced approach to analysing business problems.
Why this comparison works: Poultry Egg Production vs. SaaS Customer Retention
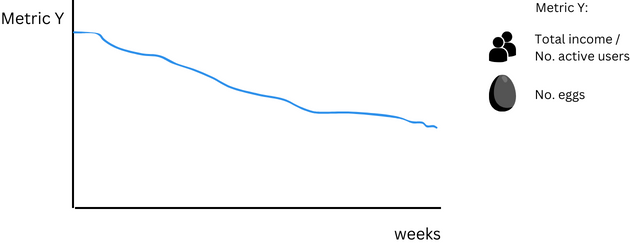
Lets look at the curve below - it could represent either customer retention, or laying hen productivity from peak lay.

There are average lifecycles for different breeds of hens - some can continue to produce high yields beyond 70 weeks. But generally, as the flock ages, the productivity (egg yield) starts to decline too. SaaS folks, sound familiar?
Both farmers and digital business owners consider ways to increase the lifetime per acquiring the user or hen (perhaps in some rare cases, both). Essentially, both involve nurturing and optimising to get the most out of their initial spend. I am not joking when I say I have used the average chicken lifetime as a point of reference for the lifetime of SaaS users.
Two lessons I have learnt by comparing the importance of this curve for each business:
- Laying hen productivity and customer retention rarely ever follow a linear trend. Polynomial regressions become a frequent friend.
- Extending the lifetime of your users or chickens may result in higher revenue for longer, and a delay in the cost of acquisition (CAC) for the next cohort. However, if you can establish a healthy retention curve, largely by lifting it, the outcomes could be much better than delaying the inevitable CAC - of which farmers have too. Troubleshooting analysis to identify where retention can be improved is the game changer.
Hen Health vs. Customer Health
I like to think of a user base as one large complex system - they exhibit characteristics of complexity akin to that of complex adaptive systems. Labelling user bases as complex systems, as we do with live organisms, encourages a scientific approach to building and retaining a user base.
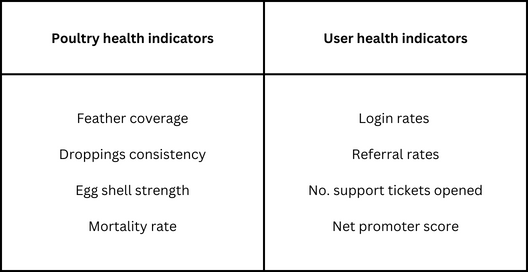
Poultry farmers monitor the health of their flock using reliable health indicators; feather coverage and egg shell strength to name a few. They're diagnostic thus prescriptive, and can treat any indications of poor health.
As SaaS analysts, it's much harder to approach intrinsic health issues, largely because the qualities of target personas and the market change with time. The other barrier in adopting this diagnostic approach is the lack of knowledge about the relevant indicators at any given time. How can analysts identify and monitor indicators of user health and likelihood to churn?

Well, it largely depends on your business model, how much data you have, and what successful product usage looks like for you. The answer to these questions should always be tailored to the business - e.g., for some businesses logging in frequently could be indicative of customer dissatisfaction rather than engagement.
But here are some best practices:
- Unlike chickens, users can talk! Gather your customer support text data and run a sentiment analysis and other natural language processing models to identify user pain points and friction that may contribute to dissatisfied users.
- The dreaded churn prediction models: techniques like logistic regression or random forests help identify users who might be at risk of leaving.
- If you're a smaller business, run multivariate correlations between different trends in user activities and their lifetimes - see if there are any relationships.
- Create a customer health score - plenty of other ways to measure and track customer health are included in this article.
Sometimes, we're convinced that any negative changes to conversion and retention numbers are due to issues within the funnel. However, it could be that you've seen changes to the composition of your traffic - it's not your button colour, maybe you just have a new strain of user! Segmentation and clustering may provide a more granular understanding of how different subsets of your user base engage with your product. You can then be prescriptive when users don't convert - could it be that this particular group of users need a more transitional approach for calls to action?
Egg Quantity vs. Product Quantity
In theory, more eggs should lead to more revenue, but some of them don't make it to the shops. It's common for farmers to find eggs that are either too big and have weaker shells, or the chickens don't lay them onto the belt.
More eggs doesn't always equal more revenue - the same can be said for increasing the number of features. Farmers know that if the quality of eggs are low, there is little return producing them. In addition, they're mindful that some eggs are more profitable than others - so ideally, we want more of those. Similar to feature use, we know there are some features that generate more value for both the user and the business - more features doesn't always equal more value.
This is a whole discussion in itself, so here's a more comprehensive article for those interested: 'Does your SaaS really need new features? A guide to what you should do instead'.
Linking this to the section above, adopting a diagnostic approach can help identify whether a new feature is necessary, or if a current feature or element of user experience should be optimised instead.
Final thought
Exploring this comparison has been very fun and valuable - these connections underscore the value of comparing and exploring diverse business domains, and applying previous lessons learnt across outwardly different problems. It helps frame the way I analyse new problems by providing frameworks to enable more structural thinking. I hope you start to do so too, and at the very least you enjoyed this read.
Thanks for reading! Feel free to reach out at sara@unravelledpatterns.com if you have any thoughts or questions.
